12 — "Die Welt" — No. 52
(continued from page 11)
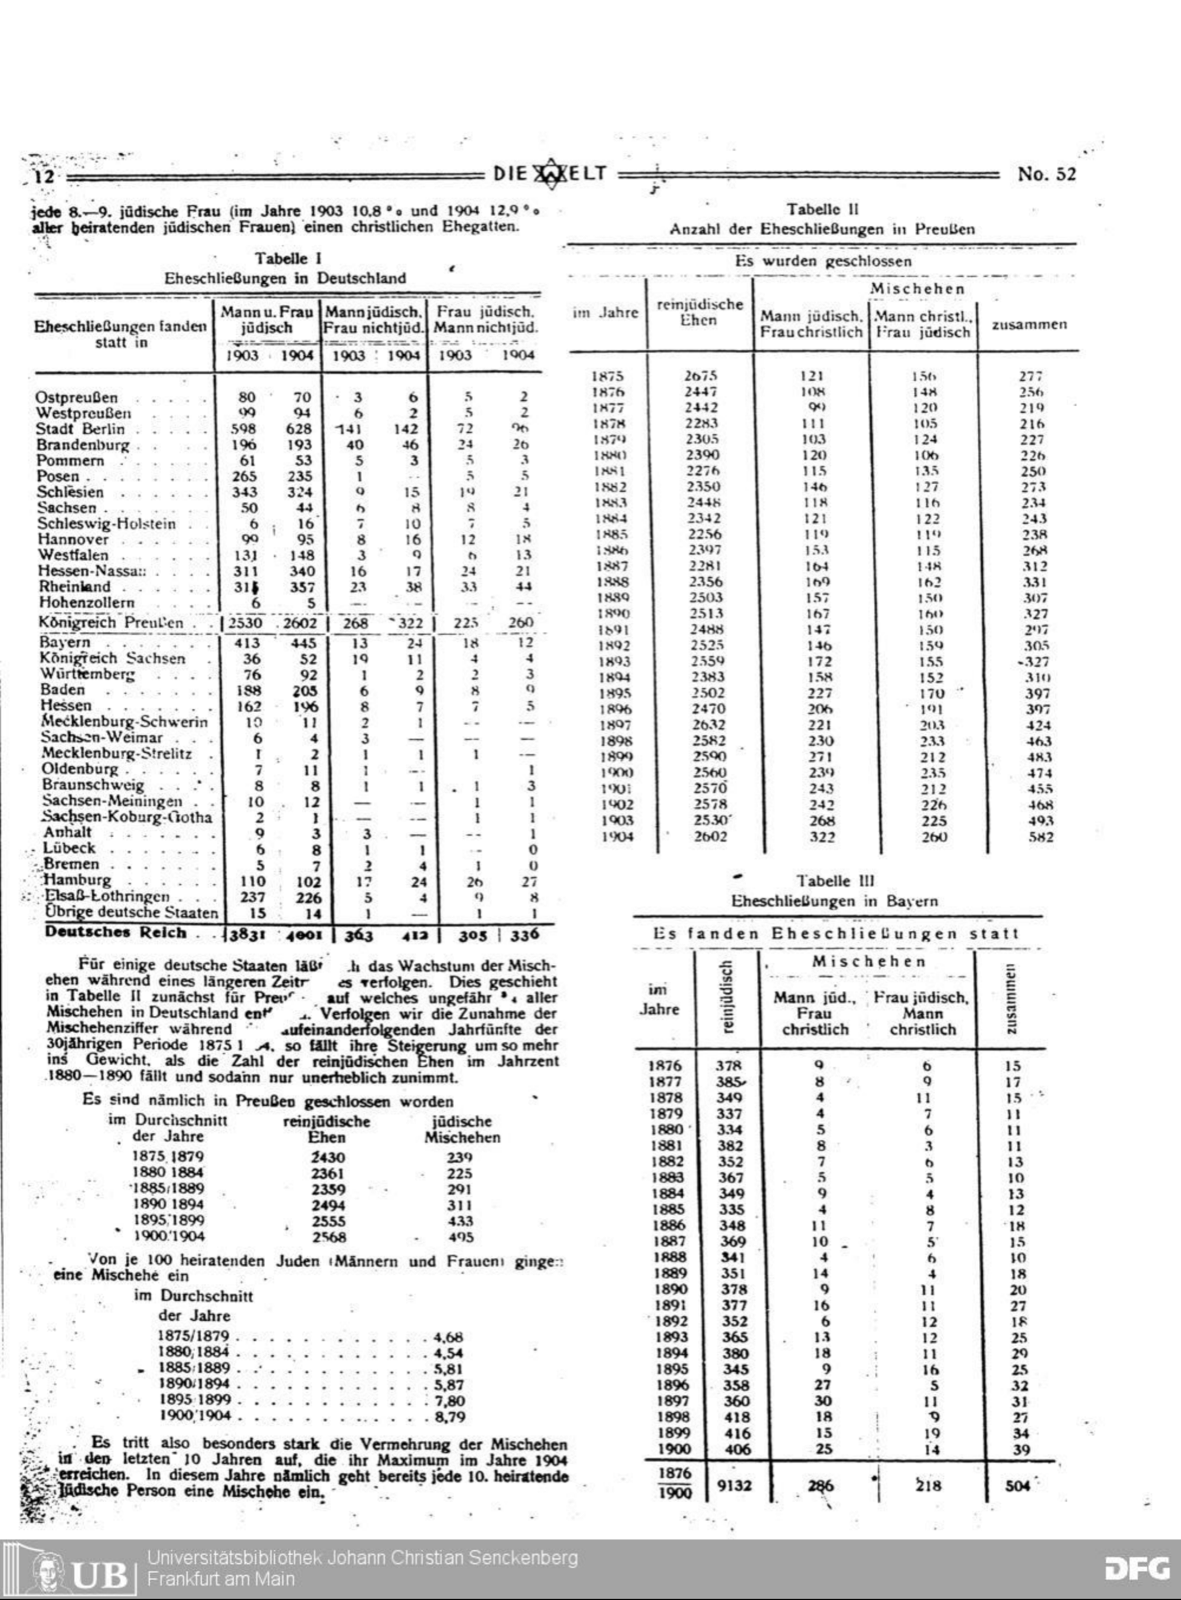
...every 8th—9th Jewish woman (in the year 1903 10,8 % and 1904 12,9 % of all Jewish women marrying) a Christian spouse.
Table I Marriages in Germany
| Marriages took place in | Husband and wife Jewish 1903 | Husband and wife Jewish 1904 | Husband Jewish, wife non-Jew. 1903 | Husband Jewish, wife non-Jew. 1904 | Wife Jewish, husband non-Jew. 1903 | Wife Jewish, husband non-Jew. 1904 |
|---|---|---|---|---|---|---|
| East Prussia | 80 | 70 | 3 | 6 | 5 | 2 |
| West Prussia | 99 | 94 | 6 | 2 | 5 | 2 |
| City of Berlin | 598 | 628 | 141 | 142 | 72 | 96 |
| Brandenburg | 196 | 193 | 40 | 46 | 24 | 26 |
| Pomerania | 61 | 53 | 5 | 3 | 5 | 3 |
| Posen | 265 | 235 | 1 | — | 5 | 5 |
| Silesia | 343 | 324 | 9 | 15 | 19 | 21 |
| Saxony | 50 | 44 | 6 | 8 | 8 | 4 |
| Schleswig-Holstein | 6 | 16 | 7 | 10 | 7 | 5 |
| Hanover | 90 | 95 | 8 | 16 | 12 | 18 |
| Westphalia | 131 | 148 | 3 | 9 | 6 | 13 |
| Hesse-Nassau | 311 | 340 | 16 | 17 | 24 | 21 |
| Rhineland | 315 | 357 | 23 | 38 | 33 | 44 |
| Hohenzollern | 6 | 5 | — | — | — | — |
| Kingdom of Prussia | 2530 | 2602 | 268 | 322 | 225 | 260 |
| Bavaria | 413 | 445 | 13 | 24 | 18 | 12 |
| Kingdom of Saxony | 36 | 52 | 19 | 11 | 4 | 4 |
| Württemberg | 76 | 92 | 1 | 2 | 2 | 3 |
| Baden | 188 | 205 | 6 | 9 | 8 | 9 |
| Hesse | 162 | 196 | 8 | 7 | 7 | 5 |
| Mecklenburg-Schwerin | 10 | 11 | 2 | 1 | — | — |
| Saxe-Weimar | 6 | 4 | 3 | — | — | — |
| Mecklenburg-Strelitz | 1 | 2 | 1 | — | 1 | — |
| Oldenburg | 7 | 11 | 1 | — | — | 1 |
| Brunswick | 8 | 8 | — | 1 | — | 3 |
| Saxe-Meiningen | 10 | 12 | — | — | 1 | 1 |
| Saxe-Coburg-Gotha | 2 | 1 | — | — | 1 | — |
| Anhalt | 9 | 3 | 3 | — | — | 1 |
| Lübeck | 6 | 8 | — | 1 | 1 | 0 |
| Bremen | 5 | 7 | 2 | 4 | 1 | 0 |
| Hamburg | 110 | 102 | 17 | 24 | 26 | 27 |
| Alsace-Lorraine | 237 | 226 | 5 | 4 | 9 | 8 |
| Other German states | 15 | 14 | 1 | — | 1 | 1 |
| German Empire | 3831 | 4001 | 363 | 412 | 305 | 336 |
For some German states the growth of mixed marriages can be followed over a longer period. This is done in Table II, first of all for Prussia, which accounts for about ¾ of all mixed marriages in Germany. If we follow the increase in the mixed-marriage figure through the successive five-year periods of the thirty years 1875/1904, its rise carries all the more weight as the number of purely Jewish marriages falls in the decade 1880—1890 and thereafter increases only insignificantly.
There were, namely, contracted in Prussia
| on the average of the years | purely Jewish marriages | Jewish mixed marriages |
|---|---|---|
| 1875/1879 | 2430 | 239 |
| 1880/1884 | 2361 | 225 |
| 1885/1889 | 2359 | 291 |
| 1890/1894 | 2494 | 311 |
| 1895/1899 | 2555 | 433 |
| 1900/1904 | 2568 | 495 |
Out of every 100 Jews marrying (men and women) there entered into a mixed marriage
| on the average of the years | |
|---|---|
| 1875/1879 | 4,68 |
| 1880/1884 | 4,54 |
| 1885/1889 | 5,81 |
| 1890/1894 | 5,87 |
| 1895/1899 | 7,80 |
| 1900/1904 | 8,79 |
The increase in mixed marriages thus appears especially strongly in the last 10 years, reaching its maximum in the year 1904. For in this year already every 10th Jewish person who marries enters into a mixed marriage.
Table II Number of Marriages in Prussia
There were contracted
| in the year | purely Jewish marriages | Mixed marriages, husband Jewish, wife Christian | Mixed marriages, husband Christ., wife Jewish | Mixed marriages together |
|---|---|---|---|---|
| 1875 | 2675 | 121 | 156 | 277 |
| 1876 | 2447 | 108 | 148 | 256 |
| 1877 | 2442 | 99 | 120 | 219 |
| 1878 | 2283 | 111 | 105 | 216 |
| 1879 | 2305 | 103 | 124 | 227 |
| 1880 | 2390 | 120 | 106 | 226 |
| 1881 | 2276 | 115 | 135 | 250 |
| 1882 | 2350 | 146 | 127 | 273 |
| 1883 | 2448 | 118 | 116 | 234 |
| 1884 | 2342 | 121 | 122 | 243 |
| 1885 | 2256 | 119 | 119 | 238 |
| 1886 | 2397 | 153 | 115 | 268 |
| 1887 | 2281 | 164 | 148 | 312 |
| 1888 | 2356 | 169 | 162 | 331 |
| 1889 | 2503 | 157 | 150 | 307 |
| 1890 | 2513 | 167 | 160 | 327 |
| 1891 | 2488 | 147 | 150 | 297 |
| 1892 | 2525 | 146 | 159 | 305 |
| 1893 | 2559 | 172 | 155 | 327 |
| 1894 | 2383 | 158 | 152 | 310 |
| 1895 | 2502 | 227 | 170 | 397 |
| 1896 | 2470 | 206 | 191 | 397 |
| 1897 | 2632 | 221 | 203 | 424 |
| 1898 | 2582 | 230 | 233 | 463 |
| 1899 | 2590 | 271 | 212 | 483 |
| 1900 | 2560 | 239 | 235 | 474 |
| 1901 | 2570 | 243 | 212 | 455 |
| 1902 | 2578 | 242 | 226 | 468 |
| 1903 | 2530 | 268 | 225 | 493 |
| 1904 | 2602 | 322 | 260 | 582 |
Table III Marriages in Bavaria
Marriages took place
| in the year | purely Jewish | Mixed marriages, husband Jew., wife Christian | Mixed marriages, wife Jewish, husband Christian | Mixed marriages together |
|---|---|---|---|---|
| 1876 | 378 | 9 | 6 | 15 |
| 1877 | 385 | 8 | 9 | 17 |
| 1878 | 349 | 4 | 11 | 15 |
| 1879 | 337 | 4 | 7 | 11 |
| 1880 | 334 | 5 | 6 | 11 |
| 1881 | 382 | 8 | 3 | 11 |
| 1882 | 352 | 7 | 6 | 13 |
| 1883 | 367 | 5 | 5 | 10 |
| 1884 | 349 | 9 | 4 | 13 |
| 1885 | 335 | 4 | 8 | 12 |
| 1886 | 348 | 11 | 7 | 18 |
| 1887 | 369 | 10 | 5 | 15 |
| 1888 | 341 | 4 | 6 | 10 |
| 1889 | 351 | 14 | 4 | 18 |
| 1890 | 378 | 9 | 11 | 20 |
| 1891 | 377 | 16 | 11 | 27 |
| 1892 | 352 | 6 | 12 | 18 |
| 1893 | 365 | 13 | 12 | 25 |
| 1894 | 380 | 18 | 11 | 29 |
| 1895 | 345 | 9 | 16 | 25 |
| 1896 | 358 | 27 | 5 | 32 |
| 1897 | 360 | 30 | 11 | 41 |
| 1898 | 418 | 18 | 9 | 27 |
| 1899 | 416 | 15 | 19 | 34 |
| 1900 | 406 | 25 | 14 | 39 |
| 1876-1900 | 9132 | 286 | 218 | 504 |