— 314 —
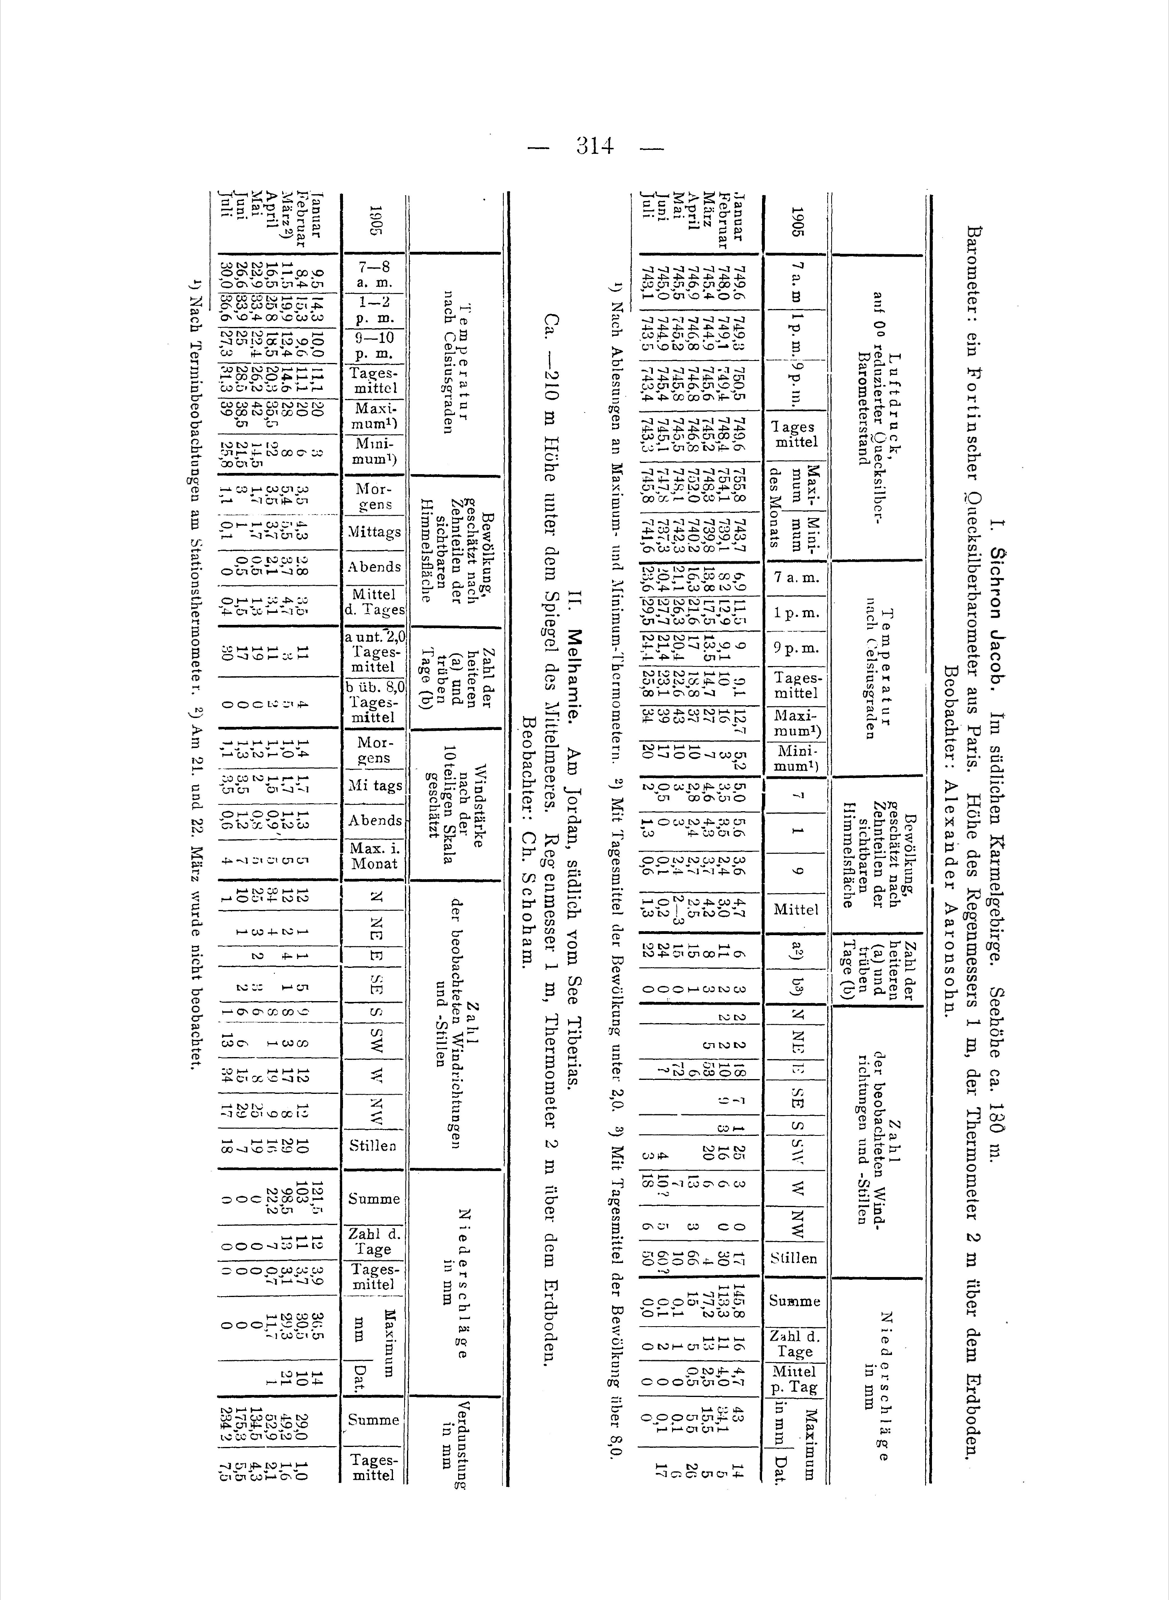
I. Zichron Jacob. In the southern Carmel range. Altitude ca. 130 m.
Barometer: a Fortin mercury barometer from Paris. Height of the rain-gauge 1 m, of the thermometers 2 m above the ground. Observer: Alexander Aaronsohn.
| Air pressure: mercury reading reduced to 0° Celsius | Temperature in degrees Celsius | Cloudiness, estimated in tenths of the visible sky | Number of clear (a) and overcast (b) days | Wind force, estimated on the scale 0—10 | Number of observed wind directions and calms | Precipitation in mm | |||||||||||||||||||||||||||
|---|---|---|---|---|---|---|---|---|---|---|---|---|---|---|---|---|---|---|---|---|---|---|---|---|---|---|---|---|---|---|---|---|---|
| 1905 | 7 a.m. | 1 p.m. | 9 p.m. | Daily mean | Maximum | Minimum | 7 a.m. | 1 p.m. | 9 p.m. | Daily mean | Maximum¹⁾ | Minimum¹⁾ | Morning | Midday | Evening | Mean of the day | a²⁾ under 2.0 | b³⁾ over 8.0 | Mean | N | NE | E | SE | S | SW | W | NW | Calms | Total | No. of days | Mean per day | Maximum in mm | Date |
| January | 749.6 | 749.3 | 750.5 | 749.8 | 755.8 | 743.7 | 6.9 | 11.5 | 9.0 | 9.1 | 12.7 | 5.2 | 5.6 | 3.6 | 4.7 | 4.6 | 6 | 3 | 2 | 2 | 10 | 18 | 7 | 1 | 25 | 3 | 17 | 0 | 145.8 | 16 | 4.7 | 43.1 | 14 |
| February | 748.0 | 749.1 | 749.4 | 748.8 | 754.1 | 739.1 | 8.2 | 12.9 | 9.1 | 10.0 | 12.7 | 5.0 | 3.5 | 2.4 | 3.0 | 3.0 | 11 | 2 | 3 | 5 | 2 | 58 | 9 | 3 | 16 | 6 | 30 | 0 | 113.3 | 11 | 4.0 | 34.1 | 5 |
| March | 745.4 | 746.8 | 745.6 | 745.9 | 752.0 | 739.8 | 13.8 | 17.5 | 13.5 | 14.7 | 16.3 | 7.6 | 4.3 | 3.7 | 4.2 | 4.1 | 8 | 2 | 2 | 10 | 6 | 61 | 6 | 20 | 6 | 66 | 4 | 77.2 | 13 | 2.5 | 15.5 | 26 | |
| April | 746.9 | 746.8 | 746.8 | 746.8 | 749.2 | 740.2 | 16.3 | 21.6 | 17.0 | 18.3 | 27.0 | 4.6 | 2.7 | 2.4 | 2.3 | 2.5 | 15 | 1 | 3 | 72 | 13 | 6 | 3 | 60? | 1.5 | 5.5 | 0.5 | 6 | |||||
| May | 745.5 | 745.2 | 745.8 | 745.5 | 748.1 | 742.3 | 21.1 | 26.3 | 20.4 | 22.6 | 37.0 | 2.8 | 2.4 | 0.1 | 0.2 | 0.9 | 24 | 0 | 2 | 4 | 10? | 4 | 1 | 50 | 0.1 | 1 | 0.1 | 0.1 | 17 | ||||
| June | 745.0 | 744.9 | 745.4 | 745.1 | 747.8 | 734.3 | 20.4 | 27.7 | 21.4 | 23.1 | 39.0 | 3.9 | 1.3 | 1.3 | 0.9 | 22 | 0 | 1 | 3 | 18 | 0.0 | 0 | 0.0 | 0.0 | |||||||||
| July | 743.1 | 743.5 | 743.4 | 743.3 | 745.8 | 741.6 | 23.6 | 29.5 | 24.1 | 25.8 | 34.0 | 2.2 | 0.6 | 0.6 | 0 | 0 | 0 | 0.0 | 0 | 0.0 | 0.0 |
¹⁾ From readings of the maximum and minimum thermometers. ²⁾ With daily mean of cloudiness under 2.0. ³⁾ With daily mean of cloudiness over 8.0.
II. Melhamie. On the Jordan, south of the Lake of Tiberias.
Ca. —210 m below the level of the Mediterranean. Rain-gauge 1 m, thermometer 2 m above the ground. Observer: Ch. Schoham.
| Temperature in degrees Celsius | Cloudiness, estimated in tenths of the visible sky | Number of clear (a) and overcast (b) days | Wind force, estimated on the scale 0—10 | Number of observed wind directions and calms | Precipitation in mm | Evaporation in mm | ||||||||||||||||||||
|---|---|---|---|---|---|---|---|---|---|---|---|---|---|---|---|---|---|---|---|---|---|---|---|---|---|---|
| 1905 | Maximum¹⁾ | Minimum¹⁾ | Morning | Midday | Evening | Mean of the day | a under 2.0 | b over 8.0 | Mean | N | NE | E | SE | S | SW | W | NW | Calms | Total | No. of days | Mean per day | Maximum in mm | Date | Total | No. of days | Mean per day |
| January | 20.4 | 11.3 | 3 | 6 | 8 | 5.7 | 11 | 4 | 1.4 | 5 | 12 | 1 | 5 | 8 | 1 | 8 | 12 | 12 | 103.5 | 12 | 1.9 | 20.5 | 29.0 | |||
| February | 20.0 | 8.6 | 3 | 3 | 0 | 2.0 | 11 | 0 | 1.0 | 1.1 | 5 | 12 | 2 | 1 | 6 | 8 | 17 | 8 | 103.5 | 11 | 2.7 | 30.5 | 29.0 | |||
| March²⁾ | 20.0 | 11.2 | 6 | 22 | 8 | 12.0 | 3 | 5 | 1.2 | 1.2 | 34 | 4 | 6 | 6 | 1 | 19 | 8 | 29 | 16 | 77.2 | 12 | 1.7 | 11.7 | 49.2 | ||
| April | 28.0 | 14.8 | 2.5 | 1.5 | 0.5 | 1.5 | 19 | 0 | 1.3 | 1.3 | 25 | 2 | 1 | 3 | 1 | 8 | 15 | 8 | 19 | 1.1 | 1 | 0.1 | 52.9 | |||
| May | 35.5 | 14.5 | 1.1 | 1.7 | 0.5 | 1.1 | 19 | 0 | 1.2 | 0.9 | 1 | 3 | 2 | 6 | 13 | 24 | 20 | 16 | 134.5 | |||||||
| June | 42.0 | 21.5 | 3.5 | 3.7 | 2.1 | 3.1 | 11 | 0 | 0.8 | 1.2 | 1 | 2 | 2 | 8 | 6 | 34 | 9 | 19 | 7 | 175.3 | ||||||
| July | 39.0 | 25.8 | 1.1 | 0.1 | 0 | 0.4 | 30 | 0 | 0.6 | 1.2 | 10 | 1 | 1 | 6 | 13 | 4 | 29 | 18 | 7 | 284.2 |
¹⁾ From fixed-hour observations at the station thermometer. ²⁾ On the 21st and 22nd of March no observations were made.
[Translator's note: This page is a densely set table printed sideways in the original. The column alignment of some cell values in the later months (April—July) of both tables is uncertain in the scan, and individual figures may sit one column out of true; the figures themselves are reproduced as read.]